|
"Imagine pushing your car for 20 miles. You can use ropes and pulleys, but no motors, no electricity. That's the hard work that we pay $3 a gallon for."
Author of: The Party's Over: Oil, War, and the Fate of Industrial Societies and Powerdown: Options and Actions for a Post-Carbon World
Peak Oil:
A variation of what follows was presented by:
Steve Andrews September 23, 2005 at the 2nd U.S. Conference on Peak Oil and Community Solutions http://www.communitysolution.org/
Reproduced on this web with permission.
Steve Andrews is a Denver-based energy consultant and freelance writer. He has worked at the National Renewable Energy Laboratory and has taught solar energy design college classes. He is also a contributor to the PBS documentary series Running on Empty and a Contributor/Participant in the Documentary: End of Suburbia http://www.endofsuburbia.com/ A short primer on PEAK OIL can be reviewed here: http://www.communitysolution.org/ppts/PeakOil.ppt Frequently asked question about peak oil are answered here: http://www.communitysolution.org/peakqanda.html Association for the Study of Peak Oil and Gas - USA http://www.aspo-usa.com/
I. Understanding the Problem: A Dozen Factors Pushing Peak Oil 2. Oil field development results in a production peak and then decline. 3. U.S. oil production peaked in 1970. 4. Discovery declines - then production declines. 5. Explosions: Population verses Vehicles 6. Additional oil discoveries defer "PEAK OIL" a few years 7. Transportation accounts for approximately 70% of U.S. oil use. 8. World’s 20 largest oil consumers 9. Demand -- the “China Factor” 11. The A-Team -- the world’s 15 largest oil producers II. Mitigating Risk: Acting Now to Reduce Peak Oil’s Impact 2. The unconventional oil cavalry… 5. Coal, nuclear, solar and wind?
|
||||||||||||||||||||||||||||||||||||||||||||||||||||||||||||||||||||||||||||||||||||||||||||||||||||||||||||||
|
I. Understanding the Problem: A Dozen Factors Pushing Peak Oil
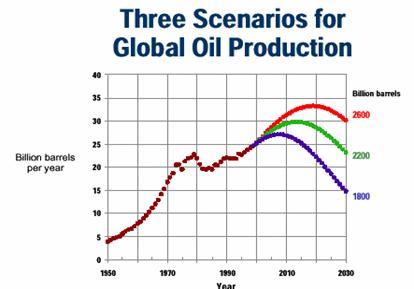
Someday, world oil production on our planet will “peak" -- output will reach an all-time high. Thereafter, a growing population will have less oil to burn. This event is not speculation; it is a matter of when -- not if. The drivers toward the eventual peak are reflected below. Timing of the peak will be affected by: geologic limits, politics, business cycles, wars and revolutions, application of technology, industry infrastructure such as pipelines, ships, etc. What happens after the peak -- the social, economic and political consequences -- will be driven by decisions and investments made now -- at the household, local, state, national and international level.
What can be done to contribute toward the mitigation of this looming issue?
|
||||||||||||||||||||||||||||||||||||||||||||||||||||||||||||||||||||||||||||||||||||||||||||||||||||||||||||||
|
Today, the World consumes 84 million barrels of petroleum per day. Think of a river, like the Colorado flowing through Glenwood Springs (CO) in July.
Today, the US consumes 21 million barrels of petroleum per day—25% of the world’s total.
|
||||||||||||||||||||||||||||||||||||||||||||||||||||||||||||||||||||||||||||||||||||||||||||||||||||||||||||||
|
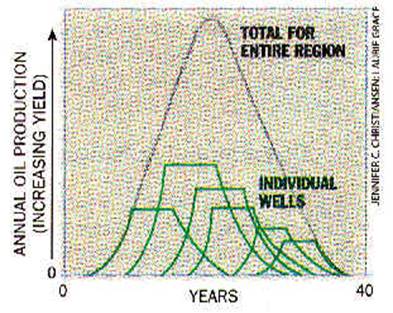
2. Oil field development results in a production peak and then decline.
Professional athletes perform best when they are young. They grow smarter with experience to offset aging. Finally their performance declines. Oil fields “perform” in the same manner, peaking and then depleting over time. Most super-giant oil fields today qualify as "middle-aged." |
||||||||||||||||||||||||||||||||||||||||||||||||||||||||||||||||||||||||||||||||||||||||||||||||||||||||||||||
|
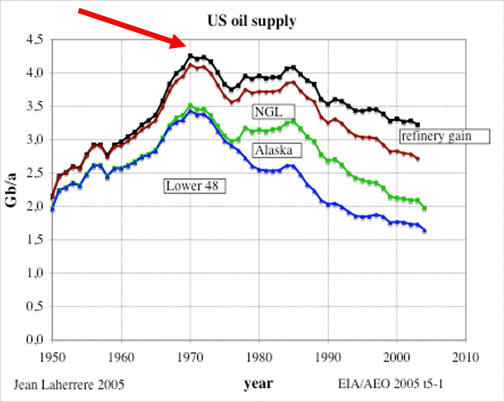
3. U.S. oil production peaked in 1970.
When all of a nation’s oil resources are aggregated, the nation's total production eventually peaks. The U.S. peaked 35 years ago. Developing Prudhoe Bay, the largest field in our history, only slowed the eventual rate of decline; drilling in the Arctic National Wildlife Refuge (ANWR) will have less impact. It is smaller and likely to be more difficult to develop. Today’s improved technology cannot offset the accelerating depletion of “mature” oil fields.
|
||||||||||||||||||||||||||||||||||||||||||||||||||||||||||||||||||||||||||||||||||||||||||||||||||||||||||||||
|
4. Discovery declines - then production declines.
Worldwide oil discovery peaked during the 1960s. Today only 1/3 as much new oil is discovered as consumed annually.
|
||||||||||||||||||||||||||||||||||||||||||||||||||||||||||||||||||||||||||||||||||||||||||||||||||||||||||||||
|
5. Explosions: Population verses Vehicles
Between 1950 and 2005, world population more than doubled to 6 billion. U.S. and world vehicles bred like rabbits, increasing 10 times.
Currently there are approximately 235 million on-road vehicles in the U.S. and 800 million total vehicles worldwide.
Oil scarcity is a liquids problem today.
|
||||||||||||||||||||||||||||||||||||||||||||||||||||||||||||||||||||||||||||||||||||||||||||||||||||||||||||||
|
6. Additional oil discoveries defer "PEAK OIL" a few years
Experts disagree over how much new oil is waiting to be discovered. Based on the current growth in petroleum demand, increasing the rate of discovery by 40% only delays the peak by 15 years! Peak timing will not be significantly impacted without a drastic reduction or elimination in the growth in demand for oil.
|
||||||||||||||||||||||||||||||||||||||||||||||||||||||||||||||||||||||||||||||||||||||||||||||||||||||||||||||
|
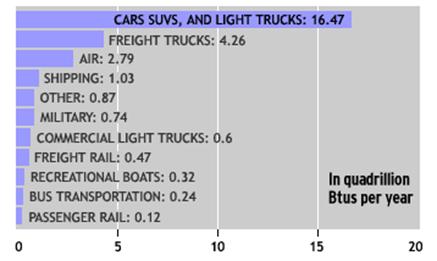
7. Transportation accounts for approximately 70% of U.S. oil use.
Transportation dominates U.S. oil consumption. Continued growth simply can’t go on. Change will come, either by: 1) choice, 2) sensible new policy initiatives, or 3) harsh “price rationing.” |
||||||||||||||||||||||||||||||||||||||||||||||||||||||||||||||||||||||||||||||||||||||||||||||||||||||||||||||
|
8. World’s 20 largest oil consumers
(BP Statatistical Review of World Energy, 2004 data)
|
||||||||||||||||||||||||||||||||||||||||||||||||||||||||||||||||||||||||||||||||||||||||||||||||||||||||||||||
|
9. Demand -- the “China Factor”
Partial data from 2004 indicate Chinese thirst for oil grew 16%. Data from the Oil & Gas Journal indicate that U.S. demand grew 700,000 barrels per day -- almost as much as China’s growth.
|
||||||||||||||||||||||||||||||||||||||||||||||||||||||||||||||||||||||||||||||||||||||||||||||||||||||||||||||
|
Three nations dominate oil production, extracting 1/3 of the world’s daily total. Once those three peak, the world peaks. Keep your eye on Saudi Arabia.
|
||||||||||||||||||||||||||||||||||||||||||||||||||||||||||||||||||||||||||||||||||||||||||||||||||||||||||||||
|
11. The A-Team -- the world’s 15 largest oil producers -- pump out 77% daily production
Italics = already reached peak. Underlined = at or near peak production. Dashed = 2025 Fantasy
|
||||||||||||||||||||||||||||||||||||||||||||||||||||||||||||||||||||||||||||||||||||||||||||||||||||||||||||||
|
55 other nations produce the world’s leftovers (23%). Oil production is increasing in half of those countries: Libya, Kazakhstan, Malaysia, Syria and Chad. These increases are more than offset by declining daily oil from post-peak Argentina, Australia, Columbia, Indonesia and Oman.
|
||||||||||||||||||||||||||||||||||||||||||||||||||||||||||||||||||||||||||||||||||||||||||||||||||||||||||||||
|
II. Mitigating Risk: Acting Now to Reduce Peak Oil’s Impact
A desperate need exists for investments to mitigate the pitfalls of peak oil. The less time remaining before daily oil production peaks, plateaus, then declines, the more urgent the need to act.
Searching for silver bullets to slay this dragon is misleading.
Oil makes up 38% of the world's commercial energy consumption. It's fluid nature and high energy density -- make it our most flexible energy resource. It is black magic.
|
||||||||||||||||||||||||||||||||||||||||||||||||||||||||||||||||||||||||||||||||||||||||||||||||||||||||||||||
|
Despite proponents’ claims, oil replacements on the horizon aren't capable of doing what oil does for us today.
Instead of searching for silver bullets, focus on the silver BB's
View options with “energy glasses” and be a harsh realist:
How much transportation service could be supplied by the alternative fuel? Consider in terms of today’s liquid fuel use, either as millions of barrels a day of new supply, or the same amount of fuel use avoided (demand reduction).
What’s the projected timetable for the arrival of the alternative supply (or demand reduction)?
What would the projected price be?
What is the net energy contribution of any new fuel option? Examine the ratio of energy inputs to energy outputs. This is referred to the “energy-profit ratio” [EPR] or energy-returned on energy invested [EROEI].
What are the political, economic, environmental and technological barriers to the alternative fuel’s wide spread use (or avoided demand)?
|
||||||||||||||||||||||||||||||||||||||||||||||||||||||||||||||||||||||||||||||||||||||||||||||||||||||||||||||
|
2. The unconventional oil cavalry…
“Unconventional oil” -- from Canadian tar sands, Venezuela’s heavy oil or even shale from the Colorado Plateau -- is dug or “melted” out of the ground. Enormous energy inputs go into this extraction process. The flow rate of production is more akin to hard-rock mining than fluid dynamics. These resources will slow, but not reverse, the rate of decline after world oil peaks.
|
||||||||||||||||||||||||||||||||||||||||||||||||||||||||||||||||||||||||||||||||||||||||||||||||||||||||||||||
|
Vehicle efficiency is our 'societal slam-dunk' mitigating action. However, replacing the auto fleet is an excruciatingly slow task. Five years into the hybrid vehicle process, 235,000 hybrids cruise U.S. roadways. That’s 0.1%. New-vehicles sales of hybrids this year is expected to be at close to 1%. This is a very slow rate of change.
|
||||||||||||||||||||||||||||||||||||||||||||||||||||||||||||||||||||||||||||||||||||||||||||||||||||||||||||||
|
Based on Energy Profit Ratio (EPR), ethanol from corn (1:1.35 to 1:1.6) is a dead-end. Cellulose-based rather than grain-based biofuels demonstrate consistently better EPR's (Brazil study). Research indicates switch-grass offers a better energy return.
Consider the total availability of non-corn biofuels today!
|
||||||||||||||||||||||||||||||||||||||||||||||||||||||||||||||||||||||||||||||||||||||||||||||||||||||||||||||
|
5. Coal, nuclear, solar and wind?
Near term, replacing oil means vehicle fill-ups with a different liquid.
When “pluggable” hybrid vehicles hit the market, the role electricity generation can play in offsetting oil consumption will increase.
Electricity from:
Coal - is the ultimate climate-change bad actor and, while more plentiful than oil, is non-renewable.
Nuclear fuel - is depleting, its lethal by-products last many thousands of years
Wind and solar - generate power on nature’s intermittent schedules, not necessarily when needed. They are renewable, work well today, and are increasing in use.
|
||||||||||||||||||||||||||||||||||||||||||||||||||||||||||||||||||||||||||||||||||||||||||||||||||||||||||||||
|
Daimler-Chrysler announced in 1998 that 100,000 hydrogen-fueled fuel-cell-powered vehicles would grace their showroom floors by 2004. Enormous technical barriers, particularly negative EROEI numbers, make it unlikely that H2 will offset oil consumption before 2020.
H2 is an energy carrier, not a fuel.
|
||||||||||||||||||||||||||||||||||||||||||||||||||||||||||||||||||||||||||||||||||||||||||||||||||||||||||||||
|
Our response to World War II showed we are capable of swift and decisive action when threatened. Failure to respond rigorously could lead to what some analysts call, rather clinically, “substantial economic disruptions in the years ahead.”
The impact of smart prudent action today will be orders of magnitude better than reaction later.
A filter for evaluating Alternative Fuels
“There are no silver bullets, only silver BB's”
1. How much fuel will be available?
2. When will the fuel be available?
3. How does the alternative fuel’s net-energy balance compare to that of oil? How many barrels of fuel are produced per barrel of input?
4. Is the fuel partly or fully renewable?
5. Are there political barriers to be overcome for this alternative fuel to play its projected role?
6. What technical and user barriers exist? New vehicle technology needed? Battery breakthrough? Fuel density?
7. What financial barriers? Are the financial requirements large? Cost of infrastructure? Cost of fuels? Cost of vehicles?
8. What infrastructure barriers? New pipelines? New refueling infrastructure?
9. What environmental issues are associated with this fuel’s development?
|
||||||||||||||||||||||||||||||||||||||||||||||||||||||||||||||||||||||||||||||||||||||||||||||||||||||||||||||